# Creating a factor
categories <- c("Low", "Medium", "High", "Medium", "Low")
factor_categories <- factor(categories)
print(factor_categories)
[1] Low Medium High Medium Low
Levels: High Low MediumMastering Categorical Data for Analysis and Visualization
Factors are an essential data type in R, designed to handle categorical data. They enable efficient data storage, sorting, visualization, and modeling. This article explores the fundamentals of factors, factor manipulation techniques, and the use of the forcats package for advanced functionality.
Factors are used to represent categorical data. They store unique categories as levels and map them to integer codes for efficiency.
# Creating a factor
categories <- c("Low", "Medium", "High", "Medium", "Low")
factor_categories <- factor(categories)
print(factor_categories)[1] Low Medium High Medium Low
Levels: High Low Medium# Levels of the factor
levels(factor_categories)[1] "High" "Low" "Medium"# Convert a character vector to a factor
char_vector <- c("A", "B", "A", "C")
factor_vector <- factor(char_vector)
print(factor_vector)[1] A B A C
Levels: A B C# Convert numeric data to a factor
numeric_vector <- c(1, 2, 1, 3)
factor_numeric <- factor(numeric_vector)
print(factor_numeric)[1] 1 2 1 3
Levels: 1 2 3By default, factor levels are ordered alphabetically. To specify a custom order:
# Custom order for levels
ordered_factor <- factor(
  categories,
  levels = c("Low", "Medium", "High")
)
print(ordered_factor)
[1] Low Medium High Medium Low
Levels: Low Medium High# Change the reference level
releveled_factor <- relevel(ordered_factor, ref = "High")
print(releveled_factor)[1] Low Medium High Medium Low
Levels: High Low Medium# Rename factor levels
levels(ordered_factor) <- c("L", "M", "H")
print(ordered_factor)[1] L M H M L
Levels: L M HThe forcats package provides powerful functions for working with factors.
library(forcats)

# Relabel levels using fct_recode
relabelled_factor <- fct_recode(
  ordered_factor,
  Low = "L",
  Medium = "M",
  High = "H"
)
print(relabelled_factor)
[1] Low Medium High Medium Low
Levels: Low Medium High# Combine levels
collapsed_factor <- fct_collapse(
ordered_factor,
Low_Med = c("Low", "Medium"),
High = "High"
)Warning: Unknown levels in `f`: Low, Medium, Highprint(collapsed_factor)[1] L M H M L
Levels: L M H# Lump levels with fewer than 2 occurrences into "Other"
lumped_factor <- fct_lump(factor_categories, n = 2)
print(lumped_factor)[1] Low Medium Other Medium Low
Levels: Low Medium Other# Default alphabetical order
alphabetical_order <- factor(categories)
print(alphabetical_order)[1] Low Medium High Medium Low
Levels: High Low Medium# Order by frequency
freq_ordered_factor <- fct_infreq(factor_categories)
print(freq_ordered_factor)[1] Low Medium High Medium Low
Levels: Low Medium HighFactors are crucial for creating clear and ordered visualizations.
library(ggplot2)
dta <- data.frame(categories = factor_categories)
plt1 <- ggplot(dta, aes(categories)) +
geom_bar() +
labs(title = "Without ordering categories") +
theme_grey(base_size = 18)
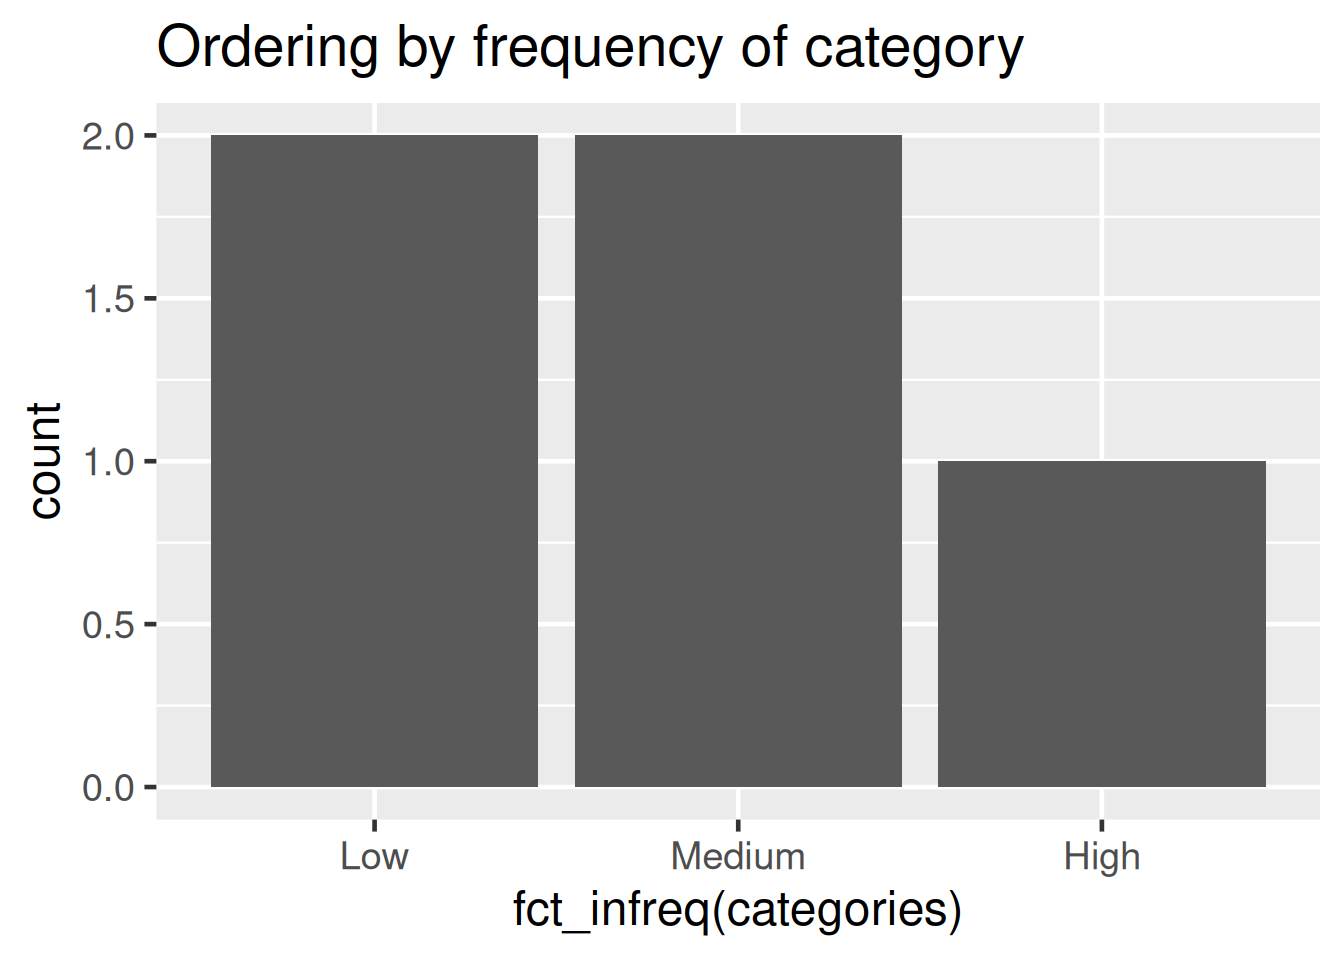
plt2 <- ggplot(dta, aes(fct_infreq(categories))) +
geom_bar() +
labs(title = "Ordering by frequency of category") +
theme_grey(base_size = 18)
plt1
plt2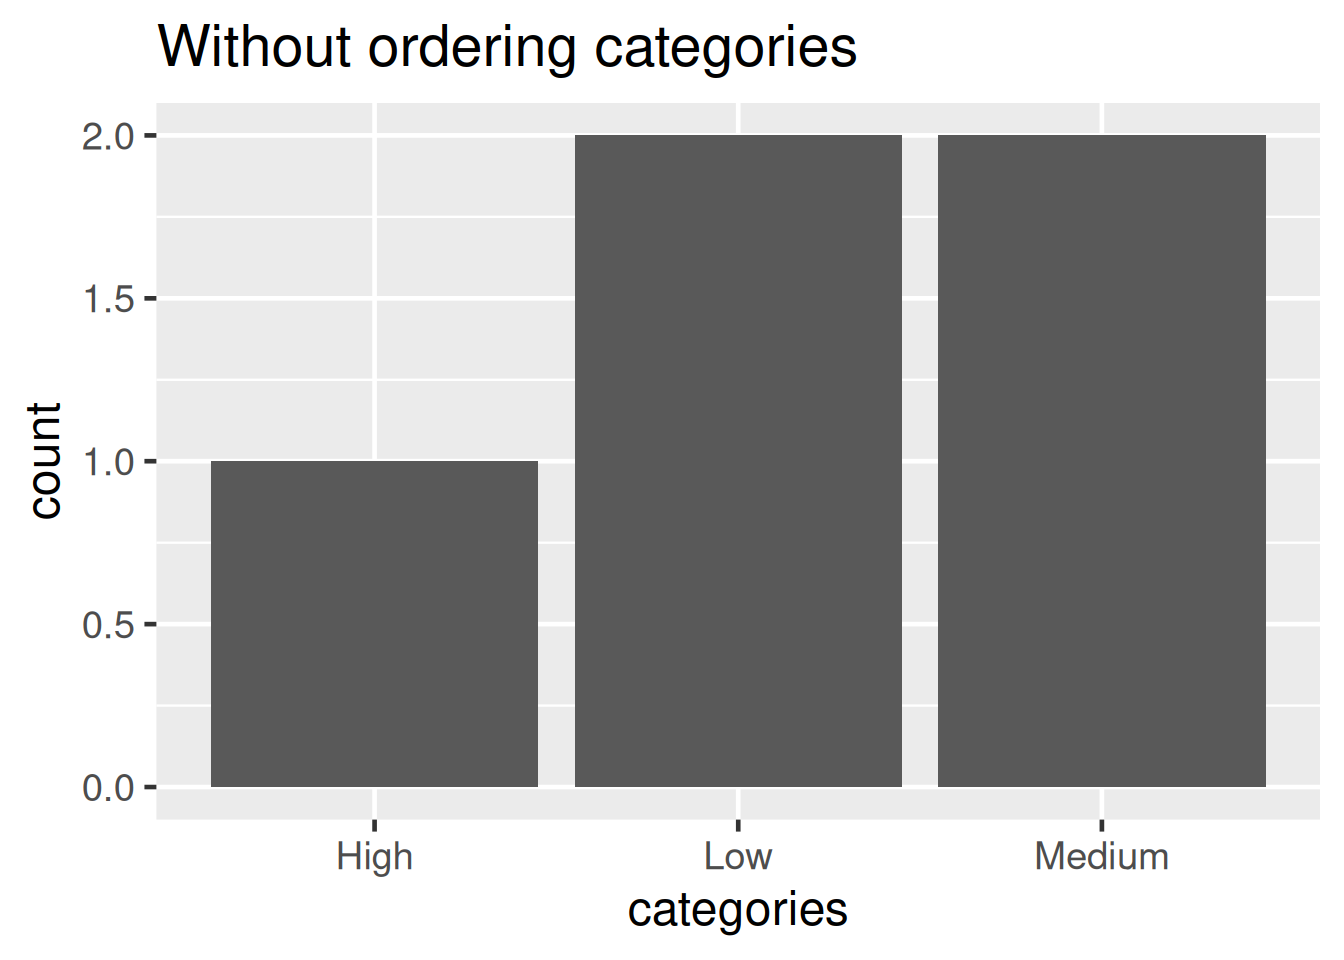
# Dropping unused levels
categories <- factor(
  c("A", "B", "C"),
  levels = c("A", "B", "C", "D", "E")
)
print(categories)
[1] A B C
Levels: A B C D Eclean_categories <- droplevels(categories)
print(clean_categories)[1] A B C
Levels: A B C# Check if an object is a factor
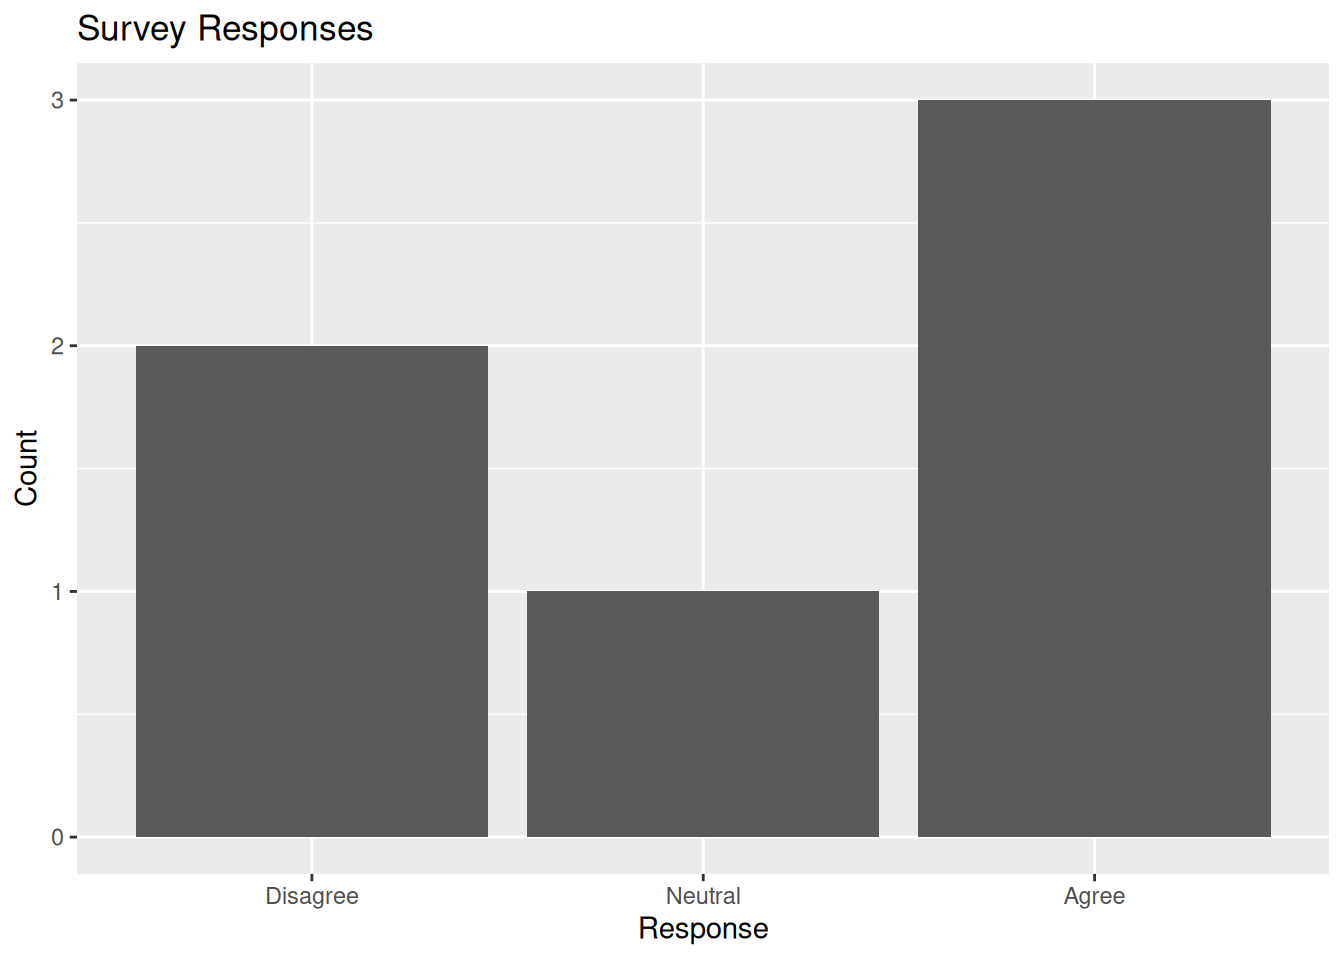
is.factor(ordered_factor)[1] TRUE# Survey data
responses <- c(
"Agree", "Neutral", "Disagree",
"Agree", "Disagree", "Agree"
)
# Convert to factor with custom levels
factor_responses <- factor(
responses,
levels = c("Disagree", "Neutral", "Agree")
)
# Plot the responses
response_df <- data.frame(responses = factor_responses)
ggplot(response_df, aes(x = responses)) +
geom_bar() +
labs(
title = "Survey Responses",
x = "Response",
y = "Count"
)
ggplot2.Factors are a cornerstone of R programming for handling categorical data. Whether you’re visualizing responses, sorting data, or building models, understanding how to work with factors is essential. By leveraging tools like the forcats package, you can efficiently manage and manipulate categorical data to unlock deeper insights.r